Resources · 50
Small samples: communicate measurement uncertainty
Show counts, period and limitations before interpreting a rate or recommending action.
· 3 min
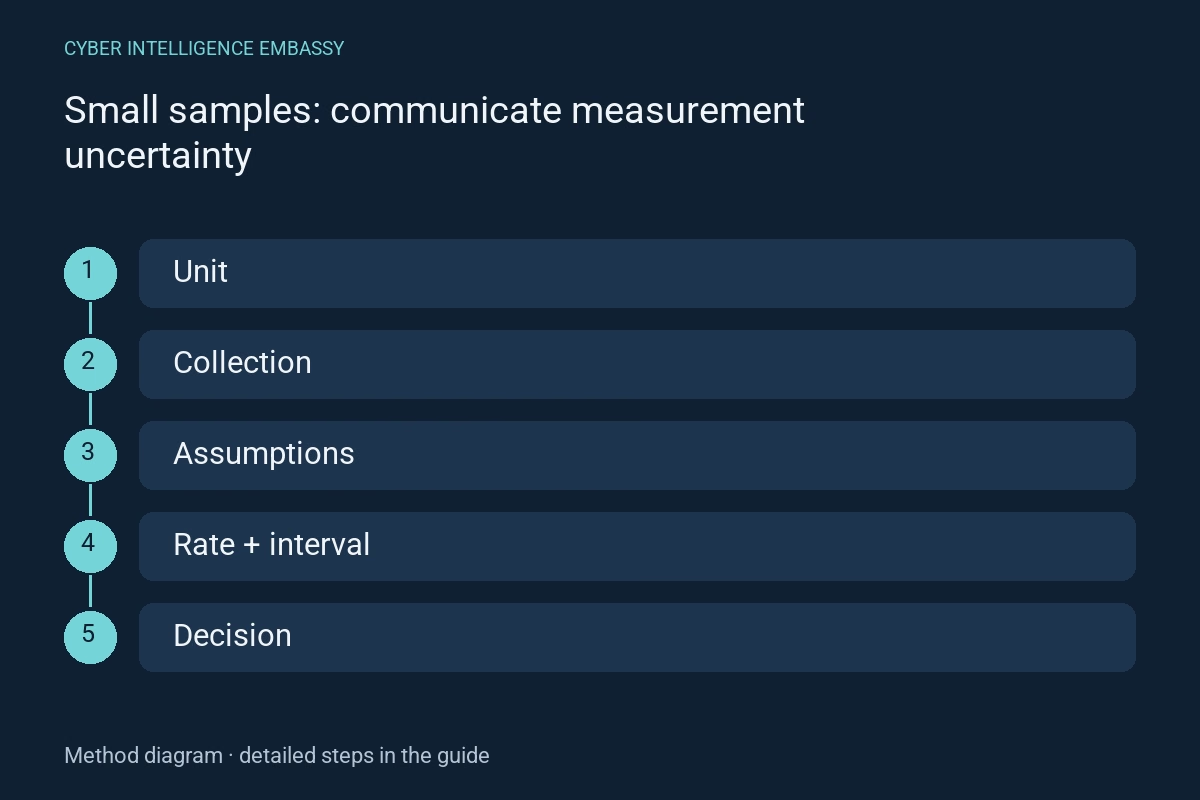
What this guide helps achieve
- Publish counts
- Separate variation from collection faults
- Name statistical assumptions
- Avoid misleading precision
Quick check
- What is the denominator?
- Is one person counted repeatedly?
- Are periods comparable?
- Who is missing from the sample?
- Which difference would change the decision?
Step-by-step method
- 01
Define the unit
State whether a rate concerns visits, people, orders or responses. Show successes and eligible units. A scope change can alter the rate without a behavioural change.
Deliverable: definition and counts.
- 02
Check collection and selection
Reconcile results with source events. Identify consent effects, absent devices, voluntary responses, deduplication and partial periods. A statistical interval cannot repair a broken counter or excluded participants.
Deliverable: coverage limitations.
- 03
Choose an appropriate method
For a binomial proportion, NIST describes Wilson and exact intervals among other methods. Check independence and sampling assumptions first. An interval calculated from repeated visits can imply unjustified precision.
Deliverable: method, level and assumptions.
- 04
Present estimate and range together
Show counts, period and method beside the estimate. In frequentist interpretation, confidence describes the repeated procedure, not the probability that a fixed parameter lies in this particular interval.
Deliverable: contextualised result.
- 05
Avoid comparison shortcuts
Do not infer a difference from interval overlap alone. Comparison requires an appropriate method, a plan and a predefined useful difference; repeated monitoring of results needs accounting for.
Deliverable: comparison protocol.
- 06
Decide with limitations
Distinguish a cheap reversible action from a lasting commitment. Report inconclusive results and name useful additional evidence. Do not select a favourable conclusion merely because the test must end.
Deliverable: decision and missing information.
Reusable worksheet
Complete with your authorised observations. These fields are a working template, not observed results.
| Field | Information to record |
|---|---|
| Measure | Successes / eligible units; definition |
| Context | Period, population, exclusions and repetitions |
| Method | Estimator, interval, level and assumptions |
| Conclusion | Observed, inconclusive, action and needed evidence |
Worked example
Illustrative situation
Calculated fictional example: 10 successes out of 100 units gives 10 %. A 95 % Wilson interval with z = 1.96 is about 5.5 % to 17.4 %, under binomial assumptions.
Decision and expected evidence
The commentary reports 10/100, period and assumptions. It promises neither the same future rate nor an improvement caused by a campaign.
Distinguish the mechanisms
| Mechanism | Purpose | Check or limitation |
|---|---|---|
| Observed rate | Describes the sample | Does not establish precision alone |
| Interval | Quantifies uncertainty under assumptions | Does not fix selection bias |
| Comparative test | Examines a difference under a plan | Does not alone establish business value |
Management indicators
| Indicator | What it measures | First action |
|---|---|---|
| Eligible count | Units actually observed | Show alongside the rate |
| Interval width | Method-dependent uncertainty | Avoid overprecise conclusions |
| Coverage | Included and absent populations | Inspect blind spots |
Common pitfalls
- Showing many decimals for a few responses
- Treating repeated visits as independent people
- Equating nonsignificance with no effect
- Hiding inconclusive results
Frequently asked questions
Does a zero rate prove zero risk?
No. No event in a limited sample does not establish impossibility in the population.
Does an interval correct bias?
No. It describes uncertainty under assumptions; coverage and collection quality still need review.
Can rates be compared visually?
Use counts and an appropriate comparison method. Interval overlap alone is not a test.
Official references
References consulted on 2 October 2026. The method and worksheet propose checks to adapt to your context; they do not constitute certification.
Continue exploring
Related analysis