Resources · 46
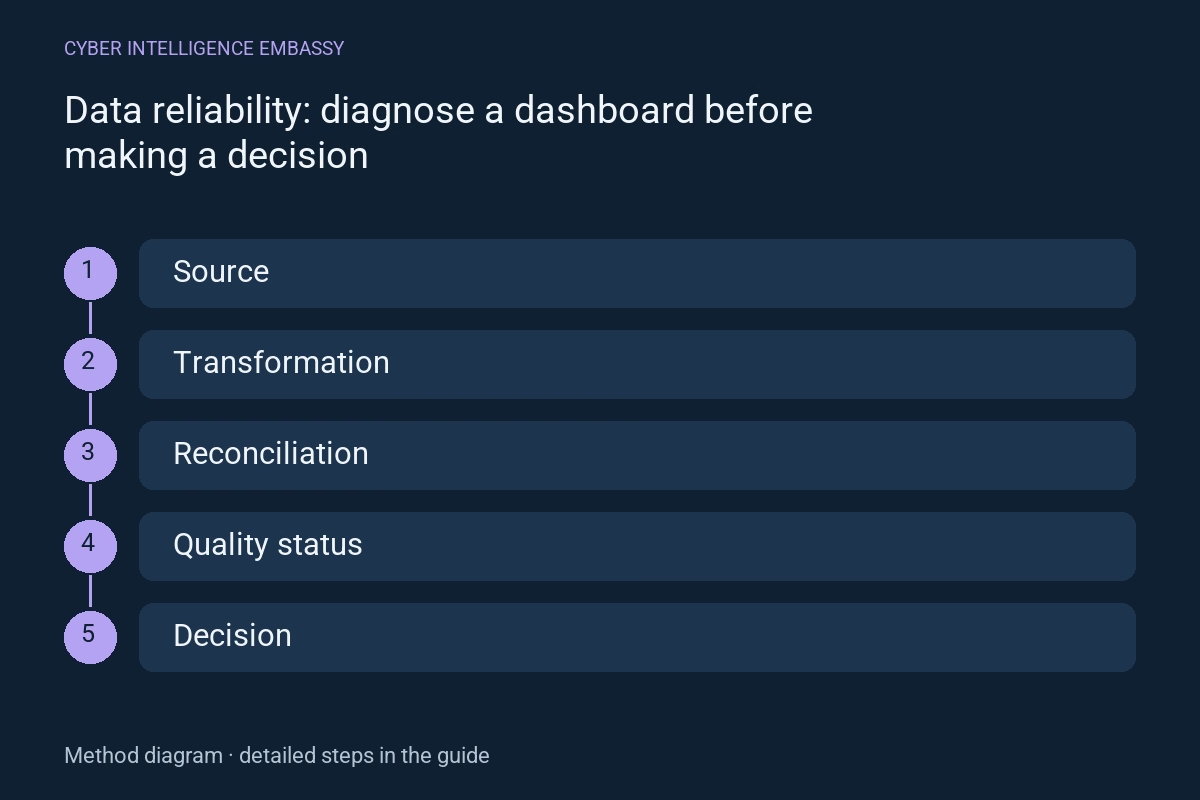
Data reliability: diagnose a dashboard before making a decision
Separate a real decline from late data, broken collection and a changed definition.
· 3 min
What this guide helps achieve
- Connect a number to sources and transformations
- Detect incomplete periods
- Distinguish missing data from zero
- Repair without counting twice
Quick check
- When was the latest event processed?
- Is the displayed period closed?
- Has the denominator changed?
- Is a missing value converted to zero?
- Does replay create duplicates?
Step-by-step method
- 01
Document the contract
Write definition, unit, dimensions, scope, time zone, frequency, source and metric owner. Specify null handling, late corrections and changes to collection or consent. An identical formula can produce incomparable figures for different populations.
Deliverable: data contract and definition history.
- 02
Trace transformations
Connect source event, storage, filtering, deduplication, aggregation and chart. Record versions, currency conversions and join rules. Follow authorised sample records end to end without copying sensitive data into the diagnostic dossier.
Deliverable: lineage and reconciliation sample.
- 03
Measure three distinct dimensions
Track freshness, completeness and correctness separately. A completed job can omit a partition; expected volume can contain incorrect values. Set thresholds around the decision and tolerable delays instead of adopting a universal percentage.
Deliverable: checks, thresholds and measurement scope.
- 04
Qualify an anomaly
Compare source and output in the same window; inspect delays, missing events, filters, joins, collection and definition. Segment only where volume remains interpretable. Label partial data instead of presenting a decline as established fact.
Deliverable: diagnosis separating facts, hypotheses and unknowns.
- 05
Repair and replay
Fix the cause in a limited scope. Replay with stable identity, deduplication and total reconciliation; confirm propagation into exports and charts. Retain the before/after values needed for explanation without unnecessary individual detail.
Deliverable: reconciliation and correction evidence.
- 06
Expose quality status
Show last update, covered period and known limitations. Give every alert an owner and an action. Retest after source or schema changes; an overall average can hide a missing segment.
Deliverable: quality status and escalation procedure.
Worked example
Illustrative situation
Illustrative situation: a chart shows fewer orders while processing for one region is delayed.
Decision and expected evidence
The page labels the partial period, processing resumes without duplicates and totals are reconciled before any commercial conclusion.
Distinguish the mechanisms
| Mechanism | Purpose | Check or limitation |
|---|---|---|
| Freshness | Is data recent enough? | Latest processed event and delay |
| Completeness | Are expected items present? | Reconciled partitions and counts |
| Correctness | Do values follow the rule? | Expected results on known cases |
Management indicators
| Indicator | What it measures | First action |
|---|---|---|
| Delay | Time between event and availability | Inspect pipeline and queues |
| Coverage | Received items against expected items | Locate missing partitions |
| Reconciliation gaps | Differences between source and output | Find filters, joins or duplicates |
Common pitfalls
- Treating missing data as zero
- Confusing successful execution with correct output
- Changing definitions without annotation
- Replaying without deduplication
Frequently asked questions
Does a statistical alert prove an error?
No. It flags a difference for investigation. A real business change and a technical failure can create similar curves.
Which freshness threshold should be used?
One the decision can tolerate, with documented scope and method. Operational monitoring and monthly reporting have different needs.
Can partial data be shown?
Yes, if scope and partial status are clearly visible and users can distinguish an estimate from a finalised period.
Official references
Continue exploring