Resources · 59
Retention cohorts: compare observable windows
Define entry, return and horizon, distinguish no return from an unobservable period and compare cohorts with completed observation windows.
· 3 min
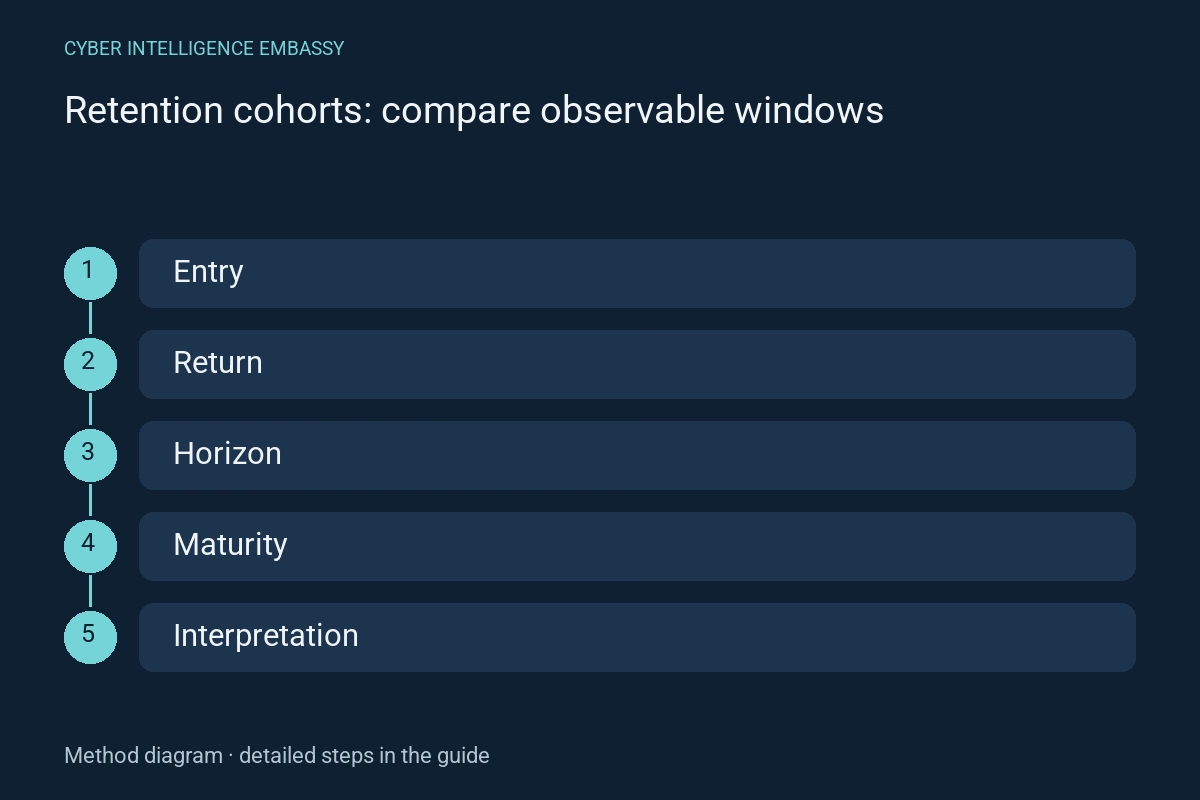
What this guide helps achieve
- Define entry
- Name the return
- Respect observable time
- Check measurement
Quick check
- Does a blank cell mean zero?
- Can recent and older cohorts be compared?
- Does higher retention prove a product effect?
Step-by-step method
- 01
Define entry
Choose an entry event, timestamp and identity rule. Decide whether someone can enter repeatedly. A signup cohort answers a different question from a purchase cohort.
Deliverable: versioned inclusion rule.
- 02
Name the return
Specify the useful event, period and calculation mode. GA4 standard, rolling and cumulative modes use different definitions; their cells must not be compared as identical retention measures.
Deliverable: numerator and denominator definitions.
- 03
Respect observable time
At a given cutoff, a recent cohort has not reached every horizon. Mark those cells unobservable rather than zero. Compare the same horizon only when the relevant window has completed.
Deliverable: cell maturity mask.
- 04
Check measurement
Inspect tracking changes, timezone, identity merging and late events. GA4 documentation states that cohorts use device data without User-ID; do not describe them as certain cross-device person counts.
Deliverable: measurement limits and change log.
- 05
Compare in context
Show counts and acquisition periods alongside rates. Channels, promotions or audience mix may explain a difference. A descriptive comparison alone does not demonstrate the causal effect of a feature.
Deliverable: conclusion and explanations to investigate.
Reusable worksheet
Complete with your authorised observations. These fields are a working template, not observed results.
| Field | Information to record |
|---|---|
| Inclusion | Event, identity and re-entry |
| Return | Event, mode and denominator |
| Calendar | Timezone, horizon and cutoff |
| Limits | Unobservable cell, collection and segments |
Worked example
Illustrative situation
Fictional example: last week’s cohort is compared with a cohort followed for two months.
Decision and expected evidence
The table masks future horizons and compares only the first observable period, with accompanying counts.
Distinguish the mechanisms
| Mechanism | Purpose | Check or limitation |
|---|---|---|
| Return in a period | Observe activity at that horizon | Do not confuse it with continuous return |
| Cumulative return | Observe any return so far | Do not read it as usage frequency |
| Unreached horizon | Identify an incomplete window | Do not record zero retention |
Management indicators
| Indicator | What it measures | First action |
|---|---|---|
| Fixed-horizon rate | Returns / members under the chosen rule | Publish counts and horizon |
| Mature cells | Fully observed windows | Exclude future horizons from comparison |
| Collection breaks | Periods with different instrumentation | Qualify affected trends |
Common pitfalls
- Do not confuse it with continuous return
- Do not read it as usage frequency
- Do not record zero retention
Frequently asked questions
Does a blank cell mean zero?
No. It can be unobservable, suppressed by a threshold or genuinely empty; name its state.
Can recent and older cohorts be compared?
Yes, at horizons observable in both, using common definitions.
Does higher retention prove a product effect?
No. Recruitment and context may change; causal conclusions require an appropriate design.
Official references
References consulted on 2 October 2026. The method and worksheet propose checks to adapt to your context; they do not constitute certification.
Continue exploring